Journal Review | Estimation of Natural Ventilation Rates in an Office Room Using the Occupant-GeneratedTracer-Gas Method (2) 본문
Journal Review | Estimation of Natural Ventilation Rates in an Office Room Using the Occupant-GeneratedTracer-Gas Method (2)
생름 2023. 7. 5. 13:28Seol, Hyeonji. Arztmann, Daniel. Kim, Naree. Balderrama, Alvaro. 2023. "Estimation of Natural Ventilation Rates in an Office Room with 145 mm-Diameter Circular Openings Using the Occupant-Generated Tracer-Gas Method." Sustainability. Vol 15. Issue 13. PDF
In part1 of this review, I specified several restrictions the Ublo ventilation experiment faced previously. Overall, Ublo’s previous studies, with difficulty, sought the way to implement the controlled environment.
What is new
In contrast, I had an impression that this research admitted its limitations. Ironically this attitude indicated that the research was more delicate and reliable in a way it found adapted solutions in reality.
Just like pre-experimental research, the author here faithfully described their experimental conditions such as the materials or location of the test room or the local climate of four seasons in Seoul. This was important sources to readers because it meant the experiment was only significant in specific surroundings. Then, the author introduced a unique method to approximate the ventilation rate while acknowledging the infiltration rate with occupants’ exhalation.
There are two ways to estimate the infiltration and ventilation rates: (1) fan pressurization tests with 8000ppm CO2 concentrations and (2) tracer gas methods with 1000ppm CO2 as a minimum requirement. For this study, the latter one, the tracer gas methods were selected for reflecting actual environmental conditions.
The study didn’t deal with window-type cases but only with four designated openings whether all-open or all-closed. The author described that the position of each D145mm circular opening on the western wall was open among rest of openings closed. This restriction advantages the research to look simpler, in a way that tracking CO2 concentration during openings closed would also allow the study to estimate the air leakage rate. This method bettered former studies which presumed no infiltration during the test, where the slits were blocked but could not be guaranteed.
The author convinced the readers of what the optimal experiment way is in the given conditions, while honestly describing what was considered and not. It guided me to understand the whole concept of the author’s intention. Likewise, the authors kindly specified other former research to refer to how buildings measured ventilation rates. From one of the resources, (Park, S et al [1]) the authors took a hint to calculate ACH(Air change rate per Hour) by measuring the decreasing gradient of indoor CO2(Cin) against constant outdoor CO2(Cout): ACH = - d(Cin − Cout) /dt. It was the same source that the author proved the minimum CO2 concentration rate (1000ppm) to be a starting point for gas tracking.
What is missing
Compared with the previous Ublo ventilation studies, this research doesn’t explain: (1) Why this research tested with D145mm circular openings/Where the dimension 145mm comes from. (2) Regarding buoyancy ventilation while properly laying out the D145mm circular openings/other ordinary types of windows. (3) How ventilation rate related to the number of openings. (4) How ventilation rate related to floor area/plan layout. The author seemingly avoided to mention ‘Ublo’ as less as possible and I believed it helped the journal gain objectiveness. At the same time, the simpler conditions in the experimental group, the deeper focus for the clear experiment.
But still, there were bright sides. This study was somewhat pre-experimental research which usually had difficulties to analyze a set of data like chaos from its 26-day tests. The dataset I shared below would be examples of how the author attempted the best to seek linear regression. The author admitted such limitations the readers might point out, for example, some ventilation results with four Ublo openings, especially during Summer, barely reached the standard ventilation rate. But as the research represented how the seasonal change and temperature difference caused ventilation rate, it would be a stepping stone for Ublo’s next round and further, find a solution for its selling point.
How to use diagrams wisely
What I liked the most about this study is the author patiently illustrated clear connections between data. These links were between the surrounding sectors for higher ventilation rates, such as wind speed, indoor-outdoor temperature difference, or CO2 concentrations difference in the field experiment where it was way more difficult to confine selected factors only. For a better understanding, I brought two examples of its related diagrams.
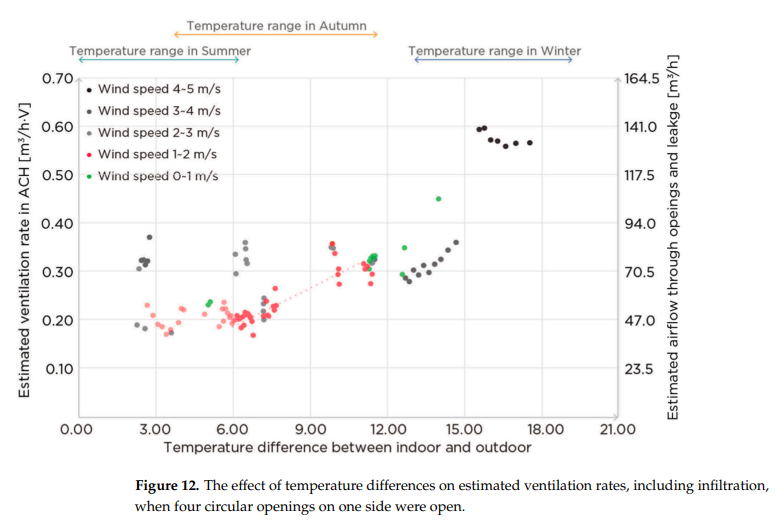
Below showed a set of data collected from three different seasons. (Summer, Autumn, and Winter) Each dot represented a link between the mean ventilation rate and temperature difference between indoors and outdoors. This temperature difference relied on seasonal flows. The dots were seemingly scattered randomly before the author divides them into several groups according to wind speed. The colors showed each group in the same range of window speed. Interestingly, when the speed was lower than 2m/s, the data had linear regression explaining that temperature difference brings about the ventilation rate.
There was another diagram composed with the same components as follows. In this case, the author attempted to find the relationship between wind speed and the ventilation rate. When the dataset was grouped by different scopes of temperature difference, a set of data within the temperature difference 3-6C had a linear trend line, indicating how an increase in wind speed outside affected the ventilation rate. The author also pointed out that the temperature difference over 15C with wind speeds over 4m/s could double the ventilation rate, specifying how the seasonal climates help ventilation.

These kinds of diagrams by the author were significant for readers with the respect that seasonal conditions that bring about natural ventilation in Seoul could be confirmed. Unlike Ublo’s former study, the author controlled the openings’ size and arrangement fixed. Thus, it was clearly capable of estimating natural ventilation and infiltration rates only depending on variables like local climates, indoor temperature, humidity, CO2 concentrations, and particulate matter while experimenting with whether the openings were open or closed.
If I were the author, it would be very difficult for me to wrap up a few single charts that compress comprehensive meanings. Not only that, I wouldn’t come up with such a test to observe the ventilation rate without considering Ublo opening variables. Because I desired to figure out whether the position of openings causes ventilation fully enough, I easily skipped the parts like what the author made in this research, and replaced them with vague theories. Furthermore, I was used to putting as many agenda as I could, for instance, what opening arrangement for good design is, how to minimize the number of openings for energy efficiency, what increased the natural ventilation rate, and so on. This kinds of mistakes were made in previous studies, which distinctly distinguished this case of study. It was well-balanced, objective, and aware of the importance of steps.
[1] Park, S.; Choi, P.; Song, D.; Koo, J. Estimation of the real-time infiltration rate using a low carbon dioxide concentration. J. Build. Eng. 2021, 42, 102835.


